What are bowtie diagrams? Bowtie diagrams can be used as a Process Safety Management tool used to visually display key major accident hazards (MAHs) showing what initiating causes could occur to cause the top event of the MAH and what preventative barriers are in place to ensure a major incident/accident doesn’t occur.
Posted
05.07.2024
Written by
It also displays the consequences which can occur from the top event and the mitigating barriers in place to reduce the severity and consequences after the top event of the MAH has taken place. The main top event of the major accident hazard is plotted in the middle, with the main causes which could cause the top event plotted on the left-hand side and preventative barriers are plotted between the causes and top event.
The consequences are plotted on the right-hand side and mitigation barriers are placed between the top event and the consequences. Typically, the diagram forms a Bowtie shape, which can be seen in Figure 1, where the Bowtie diagram gets its name. The use of colour coding can be used on the preventative and mitigation barriers (green for the barrier is present and red for the barrier not being present) which can help the user understand where the major gaps are within the barriers and whether there are any barriers for preventing certain causes or mitigating the consequences which need to be implemented.
The Bowtie diagrams can help define the basis of the safety of the process and ensure the key control measures are in place and what you need to do to ensure they are in place and fully operational. This fits well with the Swiss Cheese Model of accident causation. For example, a key control measure could be a high-level alarm to stop an overfill but it is the only barrier so you might want to consider adding a high-high level trip/alarm to add another barrier and ensure these barriers are frequently tested and inspected to ensure they remain reliable control measures.
The more barriers which are present on the preventative barriers side means the likelihood of the top event occurring is greatly reduced and this is where companies should focus their attention on solutions to ensure the risks of causes are as low as reasonably practicable (ALARP).
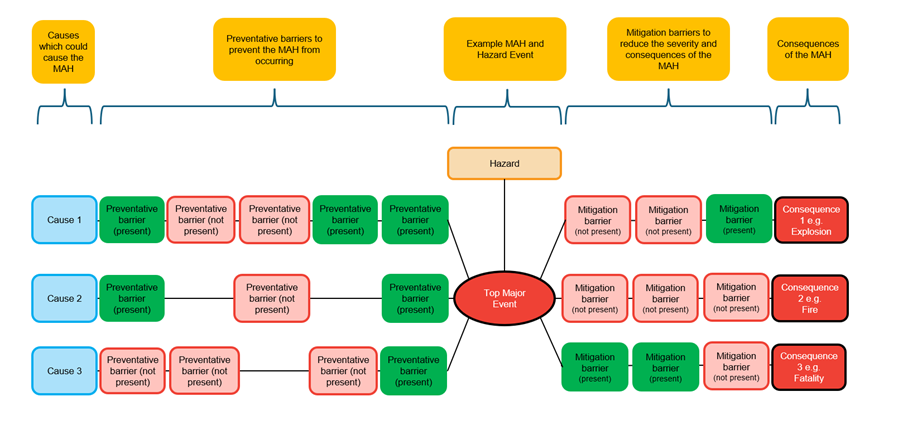
Figure 1: Simplified version of Bowtie diagram showing the key components
When to use Bowtie diagrams?
The best time to use a bowtie diagram for process safety is after the Process Hazard Analysis (PHA) or HAZOP has been carried out to understand what the main major accident hazards (MAHs) and top events are and what barriers there are already in place. Once these have been plotted on the bowtie diagram it should be easier to visually see where the main gaps are within the preventative and mitigation barriers, and this will help the operations team see where to focus any investment or quick wins to improve the process safety of the process.
Bowtie diagrams are a great communication tool for training operations staff as well as management to show visually where there are key gaps within the preventative and mitigation barriers for key major accident hazards (MAHs). It helps keep it simple for the operations team so they can see the whole process on one sheet and helps improve understanding of the process.
Bowtie diagrams also ensure compliance since an easy way to document risk management processes and demonstrate compliance with regulatory requirements and industry standards. Overall, bowtie diagrams are a valuable communication/training tool for systematically analysing and managing risks, ensuring a thorough understanding of potential hazards, their causes and their consequences. Example industries where Bowties are used frequently are chemical, manufacturing, mining and oil & gas and Finch has helped support clients in many of these industries. See some case studies of bowtie diagrams in our Case Studies section on the website.